Version 3 of eSMS-S™ has been designed to give our users more statistics from their data.
From these statistics, Safety Managers will be able to download graphs for presentations to Management and examples of these graphs are shown below.
RMS offers software programmes including:
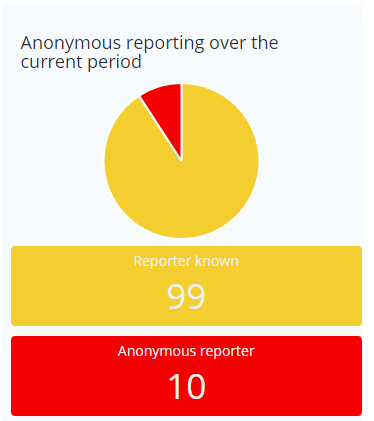
Anonymous reporting:
In the graph below, it shows 10% VS known reporting. This graph is used in conjunction with Just Culture.
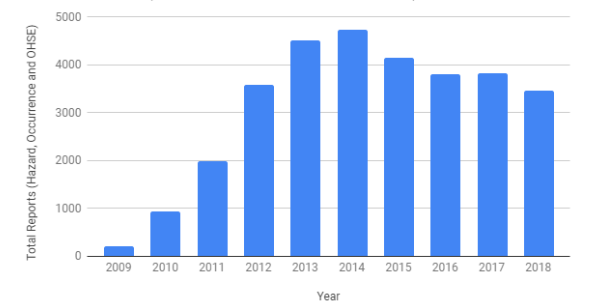
The below graph shows that within the last period of 12 months, the following number of different report types have been submitted:
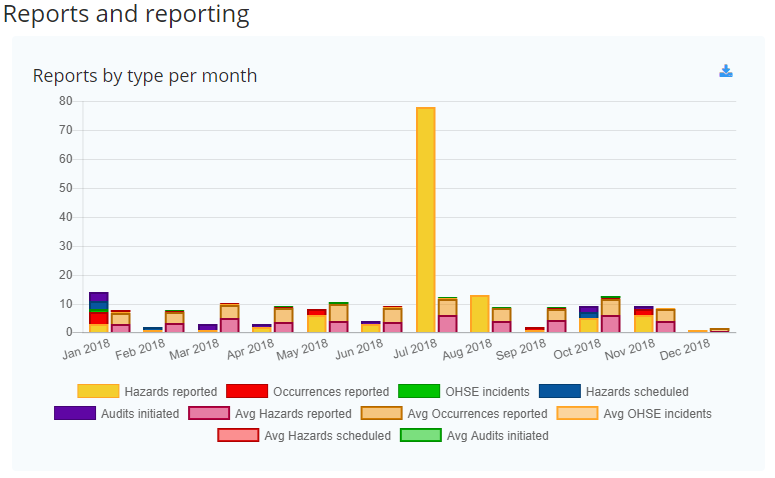
From this graph the Safety Officer is able to show all reporting in one graph but should it be required, the Safety Manager can de-select all but the graph/s that is/are specifically required - i.e. Hazards reported.
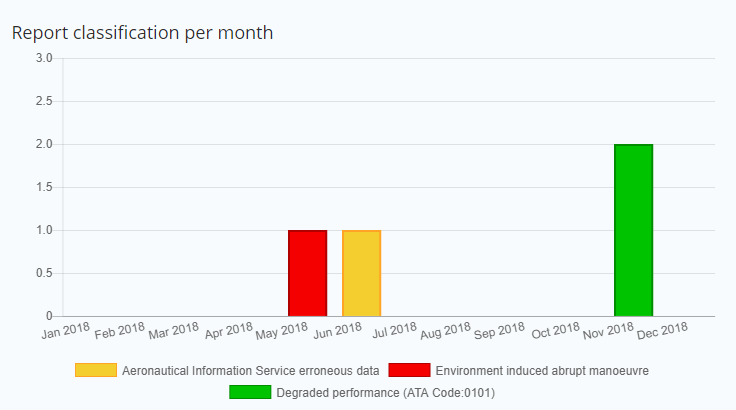
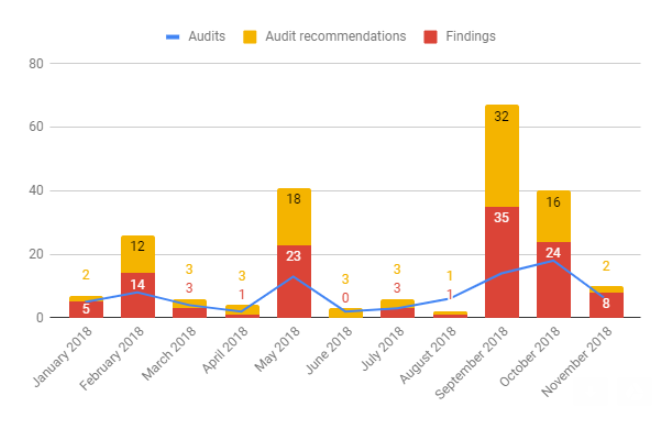
This graph above shows the different classification of Hazard Reports filed in specific months of the year January 2018 - December 2018.
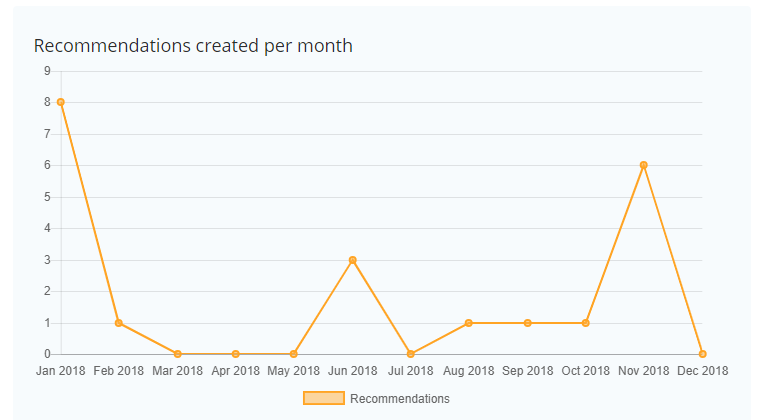
The above report /graph shows the number of Recommendations created each month to correct findings that have been made in an Audit.
Graphs can be constructed from available information - these two graphs were created as an example of what can be done; monthly findings and recommendations Audits undertaken over a period of one year.
TOTAL REPORTS (HAZARD, OCCURRENCE AND OHSE) YEAR ON YEAR:
It is envisaged that during 2019 there will be further ongoing development undertaken on the statistics eSMS-S™ can provide our users. These will include tracking and trending and root cause analysis.
Feedback on the progress of these and other developments will be supplied to our users from the eSMS-S™ helpdesk and in monthly newsletters available on the system dashboard.